Multiple Plot Charts with Chartly Examples
Chartly allows users to create multiple plots on the same figure using a
simplified interface with add_subplot(...), add_subplots(...),
add_overlay(...), and render(). The add_subplot(...) method
allows users to create a new subplot on the figure. The
add_subplots(...) method allows users to create multiple subplots in a
single call. The add_overlay(...) method allows users to overlay
additional plots on the current subplot. The render() method is used to
display the final figure once all plots have been added.
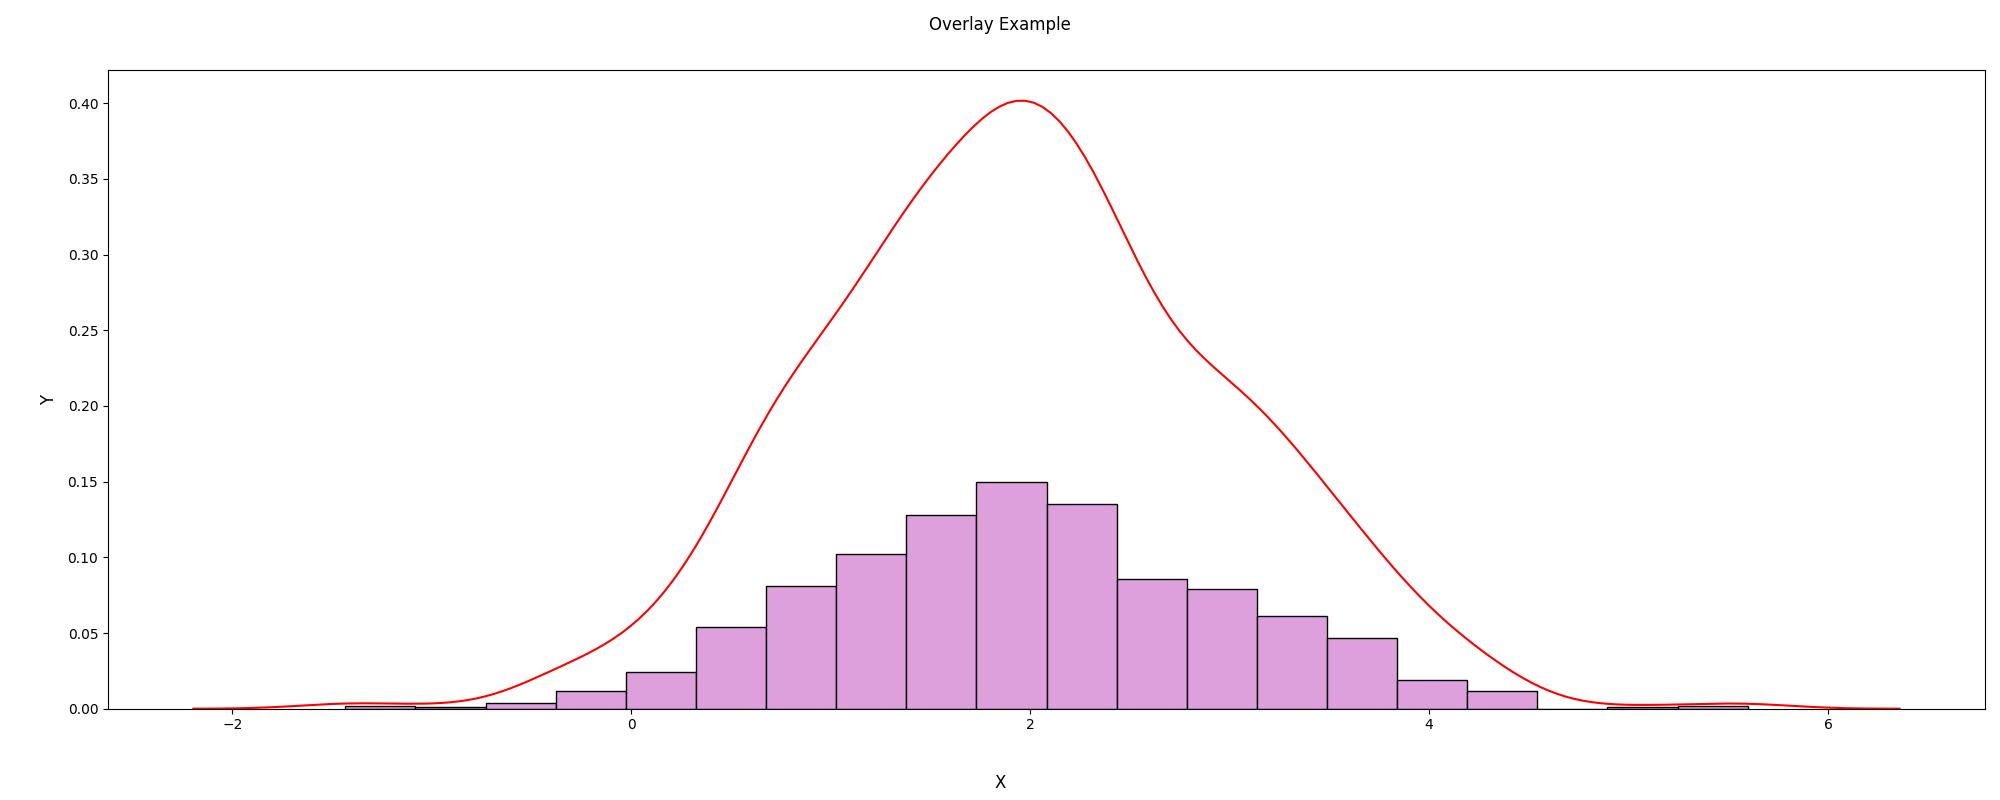
Overlay Plots
To overlay multiple plots on a single subplot, first add the subplot with
add_subplot(...) and then add additional plots to that same subplot with
add_overlay(...).
import chartly
import numpy as np

# define main figure labels
args = {
    "super_title": "Overlay Example",
    "super_xlabel": "X",
    "super_ylabel": "Y",
    "share_axes": False,
}

multi = chartly.Chart(args)

# Define Some Data
data = np.random.normal(loc=2, scale=1, size=1000)

# Add a subplot and overlay a second plot
multi.add_subplot("histogram", data)
multi.add_overlay("density", data)

multi.render()
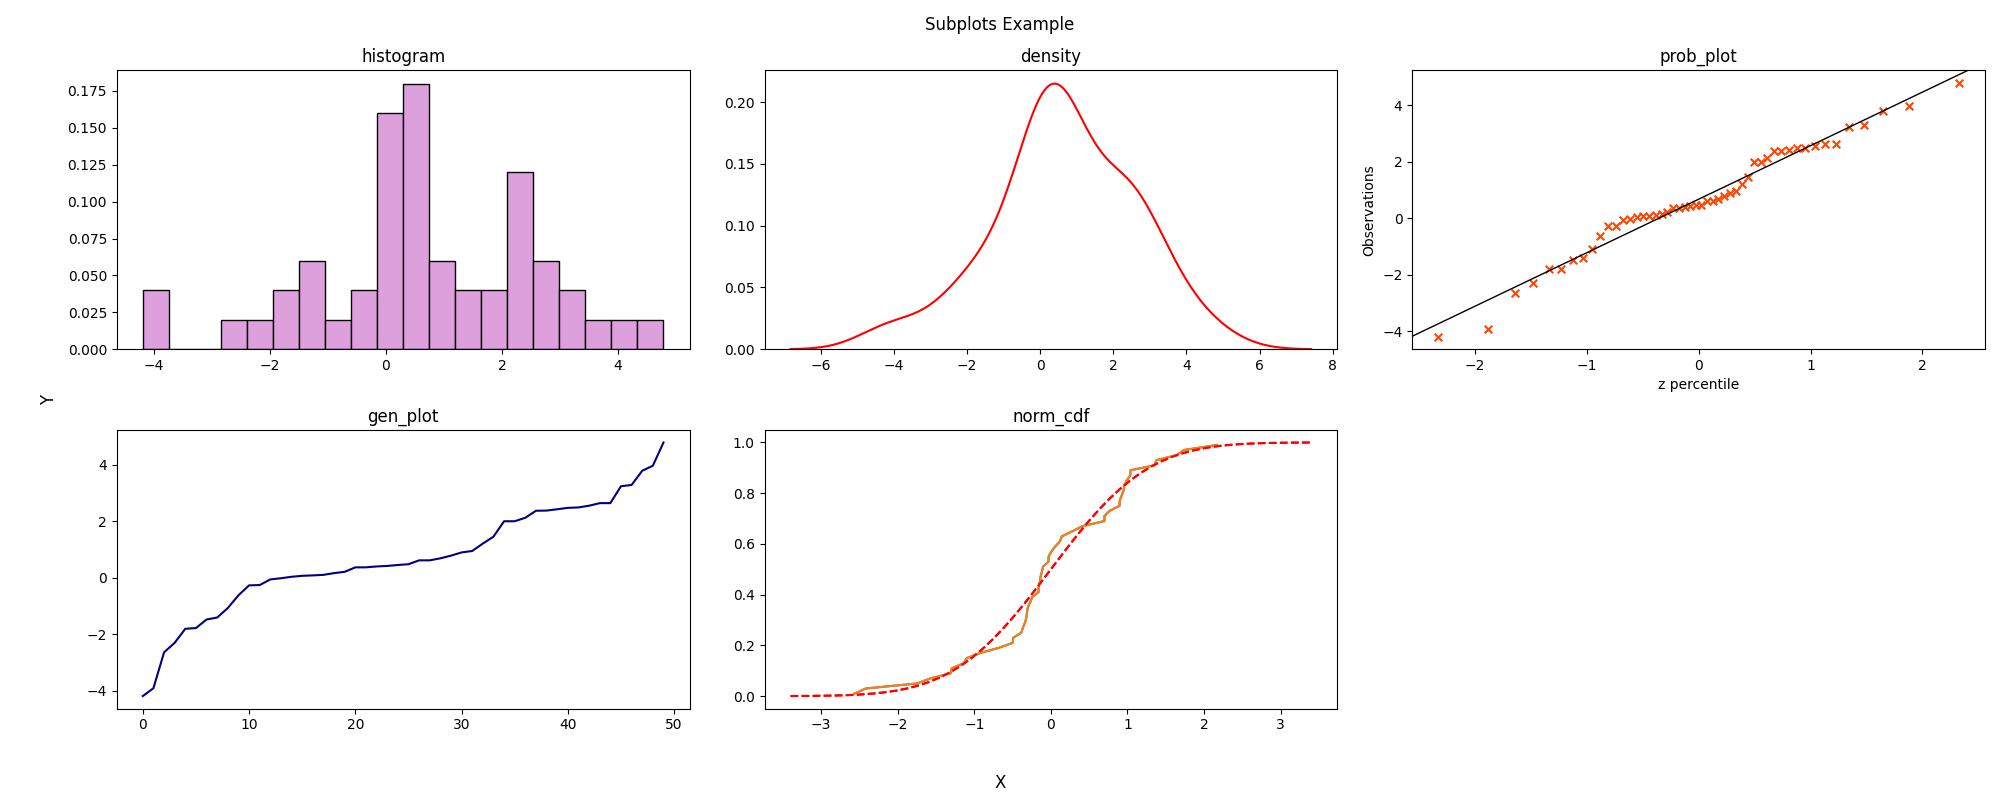
Subplots
To create multiple subplots on the same figure, add each subplot directly
with add_subplot(...) and render the figure with render() once all
subplots have been added.
import chartly
import numpy as np

# define main figure labels
args = {
    "super_title": "Subplots Example",
    "super_xlabel": "X",
    "super_ylabel": "Y",
    "share_axes": False,
}

multi = chartly.Chart(args)

# Define Some Data
data = np.random.normal(loc=0.8, scale=2, size=50)

# Define plots
plots = [
    "histogram",
    "density",
    "probability_plot",
    "line_plot",
    "normal_cdf",
]

axes_labels_list = [
    {"title": "histogram"},
    {"title": "density"},
    {"title": "prob_plot"},
    {"title": "gen_plot"},
    {"title": "norm_cdf"},
]

# Add all subplots in one call
multi.add_subplots(
    plots,
    data,
    axes_labels_list=axes_labels_list,
)

multi.render()